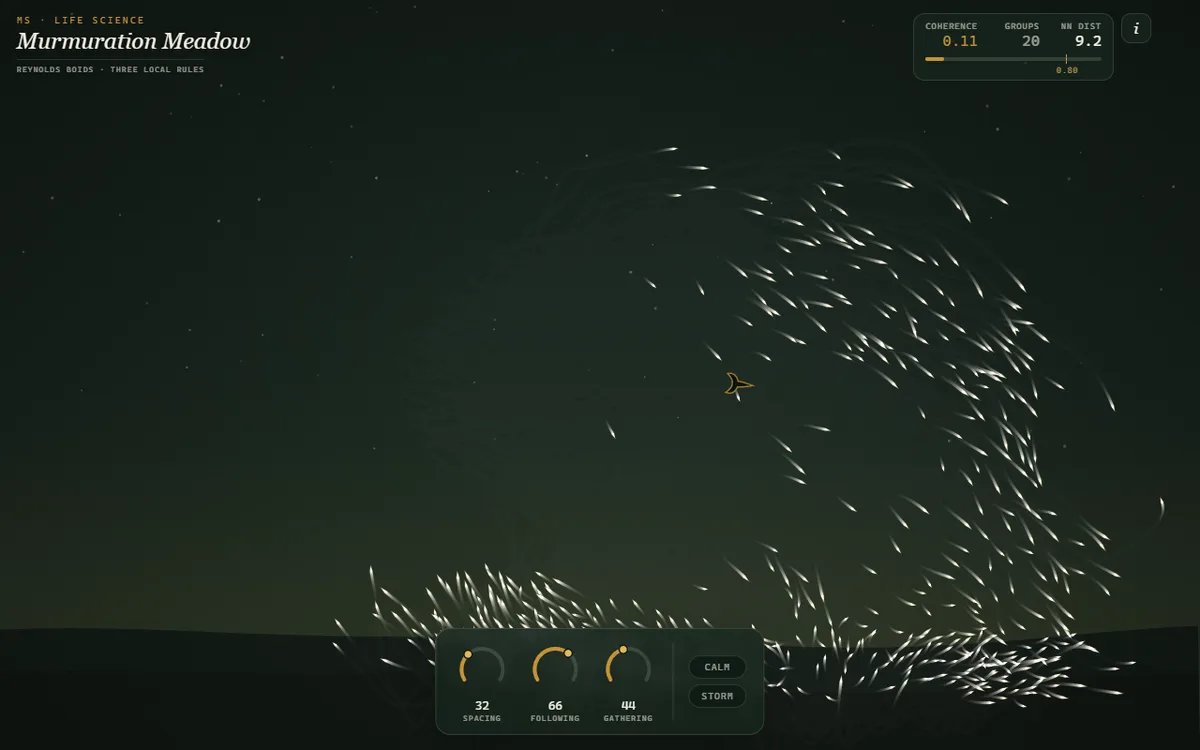
A Scolavo lab is a single HTML file you can open, break, and read. Not a video of a simulation and not an animation of one — an actual integrator running under your finger, with the physics stepping on a fixed clock underneath. There are 227 of them, they sit inside the lessons they belong to, and they also stand alone at scolavo.com/labs. None of them fetches anything from anywhere, so they keep working with the network off.
They were written by Claude, one lesson at a time. That is the part people ask about, and we will come back to it. But it is not the interesting part of this post. The interesting part is what happened when we finally looked at all of them at once.
A grid of 227 thumbnails is a directory, not an argument
For a long time the labs page was a search box and 227 poster cards. It worked, in the sense that you could find a lab. It failed at the only job that mattered: nothing on that page told you these were real simulations, and nothing told you which ones were worth your next thirty seconds. A poster of a simulation and a simulation look identical until one of them moves.
Worse, we had never actually compared them. Each lab had been reviewed on its own, in isolation, by whoever built it. Nobody had put them side by side.
Grading them cold
So we did the boring thing. Fresh 1280×800 captures of all 227, twenty to a contact sheet, and a single question asked of each cell: does this read — as a picture, with no title and no explanation — at the size a thumbnail actually gets looked at? A is a lab that could lead the page. B is solid but does not lead. C does not carry a still at all.
The first pass came back A 35, B 128, C 64. Just under a third of the corpus could not carry its own thumbnail.
The finding we did not expect
We assumed the weak ones would cluster by tier — that the Primary labs would be the thin ones, or the College ones the driest. They did not. The split was by subject. The economics and finance labs were the worst as a group, and the reason was almost funny in hindsight: a supply curve, an IS-LM crosshair, a Phillips spiral and a break-even chart are all, visually, two lines crossing on a grid. Correct, legible, and indistinguishable from one another at 200 pixels wide.
And the standout cells on every sheet had one thing in common. They were the labs that had left the house palette. Almost the whole corpus is gold-on-near-black — a deliberate, coherent choice that works beautifully for one lab on a screen and turns into wallpaper at twenty to a page. The cells your eye went to were the exceptions: a cream ledger, a blueprint, a green baize table.
The rebuild, and the re-grade
We rebuilt all 64. Not rewritten — the simulation underneath each one was left exactly as it was: every constant, every milestone, every exported variable. What changed was the drawing, which is to say what the instrument is made of and what world it is sitting in. The Plato lab became a cave lit by firelight with the prisoners drawn only as the shadows they throw. The market lab became Walras’s auction hall, where the queue at the counter is the quantity demanded. The gene-mapping lab became pencil on parchment, because Sturtevant’s 1913 map was pencil on paper.
Then we captured all 227 again and graded them the same way, against the archived originals: A 35 → 55, B 128 → 170, C 64 → 2. Of the 64 rebuilt, 20 now lead the page, 42 are solid, and 2 still do not carry a still — both flagged by the model that rebuilt them, unprompted, before we looked.
One discipline worth naming: only the 64 that changed were re-judged. The other 163 were never touched, so their first grade stands. Re-scoring them from memory would have invented movement that did not happen, and that is a very easy way to make a before-and-after look better than it was.
Nine of the twenty promotions took the palette lever. It remains the cheapest and most reliable way to make a cell stand out — and it would stop working immediately if every lab took it, which is the whole reason it works now.
Four bugs, three of them silent
Pressing every control in a lab you are redrawing turns up things that reviewing it never does.
- A cache-coherence lab referenced a constant that was never declared. Pressing the one control the lab exists to demonstrate threw — and the lab caught its own error and showed a friendly “hit a snag” card. No console error, no stalled frame loop, a perfectly healthy-looking page. It was live.
- The same lab defined a function to sample its history traces and never called it. Both traces had always been flat zero lines.
- A confidence-interval lab advanced its reveal timer every tick, which pinned the reveal’s age at zero. The “Reveal seam” button drew its label and then rendered the seam at zero opacity. It had never visibly worked.
- A string-physics lab had a sign error, so a released string teleported to the mirror side instead of springing back.
The first one is the instructive one. Every automated check we had said that lab was healthy: it rendered at 61fps, it painted its canvases, it logged nothing. A lab that catches its own exceptions and shows a friendly card is invisible to all of that. The only way to find it was to press the button.
So we wrote a sweep that loads every lab and clicks every visible control in it, watching for that error card. Before trusting it, we pointed it at a frozen copy of the known-broken lab to confirm it actually reported the fault — a detector you have never seen fail on a real defect is not a detector, it is a green light. Across all 227: zero crashing labs.
What the corpus is, measured
These numbers are counted over the files rather than remembered. We mention that because an earlier draft of our own copy quoted a line count that 64 rebuilds had made stale by about ten thousand lines.
- 227 instruments, 302,794 lines, about 1,334 lines to a lab.
- Zero dependencies and zero external hosts — no framework, no CDN, no build step, nothing fetched at runtime.
- 227 of 227 step on a fixed timestep: real integration, not tweened frames.
- 183 use typed arrays in the hot loop; 122 are seeded, so a run reproduces exactly.
- 227 of 227 honour reduced-motion and drive from the keyboard. None of them touch local storage.
You can check all of it. view-source: works on every one of them — the integrator, the renderer and the copy are right there in the file.
Where to start
- The Persistence Projector — crank the shutter until the still frames fuse, then catch the wheel rolling backward.
- The Gerrymander Workshop — nobody changes their vote. Only the district lines move, and the seat count flips.
- The Cave Projector — firelight, a wall, and prisoners drawn only as the shadows they throw.
- Seismic Triangulation — one station gives you a circle, not a point. Cross three and you have the epicentre.
- The Pond Chain — take the herons out and the minnows do not thrive. They boom, eat everything, then starve.
- The SVD Assay — a face rebuilt one singular value at a time, then the same arithmetic on a point cloud.